MySQL High Availability at Eventbrite

Situation

Eventbrite has been using MySQL since its inception as a company in 2006. MySQL has served the company well as an OLTP database and we’ve leveraged the strong features of MySQL such as native replication and fast reads, as well as dealt with some of its pain points such as impactful table ALTERs. The production environment relies heavily on MySQL replication. It includes a single primary instance for writes and a number of secondary replicas to distribute the reads.  

Fast forward to 2019.  Eventbrite is still being powered by MySQL but the version in production (MySQL 5.1) is woefully old and unsupported. Our MySQL production environment still leans heavily on native MySQL replication. We have a single primary for writes, numerous secondary replicas for reads, and an active-passive setup for failover in case the primary has issues. Our ability to failover is complicated and risky which has resulted in extended outages as we’ve fixed the root cause of the outage on the existing primary rather than failing over to a new primary. 

If the primary database is not available then our creators are not creating events and our consumers are not buying tickets for these events. The failover from active to passive primary is available as a last resort but requires us to rebuild a number of downstream replicas. Early in 2019, we had several issues with the primary MySQL 5.1 database and due to reluctance to failover we incurred extended outages while we fixed the source of the problems. 

The Database Reliability Engineering team in 2019 was tasked first and foremost with upgrading to MySQL 5.7 as well as implementing high availability and a number of other improvements to our production MySQL datastores. The goal was to implement an automatic failover strategy on MySQL 5.7 where an outage to our primary production MySQL environment would be measured in seconds rather than minutes or even hours. Below is a series of solutions/improvements that we’ve implemented since mid-year 2019 that have made a huge positive impact on our MySQL production environment. 

Solutions

MySQL 5.7 upgrade

Our first major hurdle was to get current with our version of MySQL. In July, 2019 we completed the MySQL 5.1 to MySQL 5.7 (v5.7.19-17-log Percona Server to be precise) upgrade across all MySQL instances. Due to the nature of the upgrade and the large gap between 5.1 and 5.7, we incurred downtime to make it happen. The maintenance window lasted ~30 minutes and it went like clockwork. The DBRE team completed ~15 Failover practice runs against Stage in the days leading up to the cut-over and it’s one of the reasons the cutover was so smooth. The cut-over required 50+ Engineers, Product, QA, Managers in a hangout to support with another 50+ Engineers assuming on-call responsibilities through the weekend. It was not just a DBRE team effort but a full Engineering team effort!

Not only was support for MySQL 5.1 at End-of-Life (more than 5 years ago) but our MySQL 5.1 instances on EC2/AWS had limited storage and we were scheduled to run out of space at the end of July. Our backs were up against the wall and we had to deliver! 

As part of the cut-over to MySQL 5.7, we also took the opportunity to bake in a number of improvements. We converted all primary key columns from INT to BIGINT to prevent hitting MAX value. We had a recent production incident that was related to hitting the max value on an INT auto-increment primary key column. When this happens in production, it’s an ugly situation where all new inserts result in a primary key constraint error. If you’ve experienced this pain yourself then you know what I’m talking about. If not then take my word for it.  It’s painful!

In parallel with the MySQL 5.7 upgrade we also Upgraded Django to 1.6 due a behavioral change in MySQL 5.7 related to how transactions/commits were handled for SELECT statements. This behavior change was resulting in errors with older version of Python/Django running on MySQL 5.7

Improved MySQL ALTERs

In December 2019, the Eventbrite DBRE successfully implemented a table ALTER via  gh-ost on one of our larger MySQL tables.  The duration of the ALTER was 50 hours and it completed with no application impact. So what’s the big deal?  

The big deal is that we could now ALTER tables in our production environment with little to no impact on our application, and this included some of our larger tables that were ~500GB in size.

Here is a little background. The ALTER TABLE statement in MySQL is very expensive. There is a global write lock on the table for the duration of the ALTER statement which leads to a concurrency nightmare.  The duration time for an ALTER is directly related to the size of the table so the larger the table, the larger the impact.  For OLTP environments where lock waits need to be as minimal as possible for transactions, the native MySQL ALTER command is not a viable option. As a result, online schema-change tools have been developed that emulate the MySQL ALTER TABLE functionality using creative ways to circumvent the locking.

Eventbrite had traditionally used pt-online-schema-change (pt-osc) to ALTER MySQL tables in production. pt-osc uses MySQL triggers to move data from the original to the “duplicate” table which is a very expensive operation and can cause replication lag.  Matter of fact, it had directly resulted in several outages in H1 of 2019 due to replication lag or breakage. 

GitHub introduced a new Online Schema Migration tool for MySQL (gh-ost ) that uses a binary log stream to capture table changes, and asynchronously applies them onto a “duplicate” table. gh-ost provides control over the migration process and allows for features such as pausing, suspending and throttling the migration. In addition, it offers many operational perks that make it safer and trustworthy to use. It is:

  • Triggerless
  • Pausable
  • Lightweight
  • Controllable
  • Testable

Orchestrator

Next on the list was implementing improvements to MySQL high availability and automatic failover using Orchestrator. In February of 2020 we implemented a new HAProxy layer in front of all DB clusters and we released Orchestrator to production!

Orchestrator is a MySQL high availability and replication management tool. It will detect a failure, promote a new primary, and then reassign the name/VIP. Here are some of the nice features of Orchestrator:

  • Discovery – Orchestrator actively crawls through your topologies and maps them. It reads basic MySQL info such as replication status and configuration. 
  • Refactoring – Orchestrator understands replication rules. It knows about binlog file:position and GTID. Moving replicas around is safe: orchestrator will reject an illegal refactoring attempt.
  • Recovery – Based on information gained from the topology itself, Orchestrator recognizes a variety of failure scenarios. The recovery process utilizes the Orchestrator’s understanding of the topology and its ability to perform refactoring. 

Orchestrator can successfully detect the primary failure and promote a new primary. The goal was to implement Orchestrator with HAProxy first and then eventually move to Orchestrator with ProxySQL.

Manual failover tests

In March of 2020 the DBRE team completed several manual/controlled fail-overs using Orchestrator and HAProxy. Eventbrite experienced some AWS hardware issues on the MySQL primary and completing manual failovers was the first big test. Orchestrator passed the tests with flying colors.

Automatic failover

In May of 2020 we enabled automatic fail-over for our production MySQL data stores. This is a big step forward in addressing the single-point-of-failure situation with our primary MySQL instance. The DBRE team also completed several rounds of testing in QA/Stage for ProxySQL in preparation for the move from HAProxy to ProxySQL.

Show time

In July 2020, Eventbrite experienced hardware failure on the primary MySQL instance that resulted in automatic failover.  The new and improved automatic failover process via Orchestrator kicked in and we failed over to the new MySQL primary in ~20 seconds. The impact to the business was astronomically low! 

ProxySQL

In August of 2020 we made the jump to ProxySQL across our production MySQL environments.  ProxySQL is a proxy specially designed for MySQL. It allows the Eventbrite DBRE team to control database traffic and SQL queries that are issued against the databases. Some nice features include:

  • Query caching
  • Query Re-routing – to separate reads from writes
  • Connection pool and automatic retry of queries

Also during this time period we began our AWS Aurora evaluation as we began our  “Managed Databases” journey. Personally, I prefer to use the term “Database-as-a-Service (DBaaS)”. Amazon Aurora is a high-availability database that consists of compute nodes replicated across multiple availability zones to gain increased read scalability and failover protection.  It’s compatible with MySQL which is a big reason why we picked it.

Schema Migration Tool

In September of 2020, we began testing a new Self-Service Database Migration Tool to provide interactive schema changes (invokes gh-ost behind the scene).  It supports all “ALTER TABLE…”, “CREATE TABLE…”, or “DROP TABLE…” DDL statements. 

It includes a UI where you can see the status of migrations and run them with the click of a button:

Any developer can file and run migrations, and a DBRE is only required to approve the DDL (this is all configurable though). Original source for the tool can be found here shift. We’ve not pushed to production yet but we do have a running version in our non-prod environment.

Database-as-a-Service (DBaaS) and next steps

We’re barreling down the “Database-as-a-Service (DBaaS)” path with Amazon Aurora. 

DBaaS flips the DBRE role a bit by eliminating mundane operational tasks and allowing the DBRE team to align our work more closely with the business to derive value from the data assets that we manage. We can then focus on lending our DBA skills to application teams and end users—helping deliver new features, functionality, and proactive tuning value to the core business. 

Stay tuned for updates via future blog posts on our migration to AWS Aurora! We’re very interested in the scaled read operations and increased availability that Aurora DB cluster provides. Buckle your seatbelt and get ready for a wild ride 🙂  I’ll provide an update on “Database-as-a-Service (DBaaS)” at Eventbrite in my next blog post!

All comments are welcome! You can message me at ed@eventbrite.com. Special thanks to Steven Fast for co-authoring this blog post.

Building a Protest Map: A Behind the Scenes Look!

Sometimes, a project that you’re most proud of or passionate about isn’t one that involves architecture diagrams or deep technical discussions. Sometimes, the most significant project is one that allows peers to come together to build something that can have a positive impact. When we can all collaborate for a cause we’re passionate about, and get quick buy-in from our colleagues and executives, we can create a feature we’re proud of. 

Such is the case with Eventbrite’s Protests map. If you’ve visited the Eventbrite homepage recently, you’ve probably seen our map highlighting protests and marches to support racial equality, hosted on Eventbrite.

The map features events across the U.S., and the data source for the events shown is a Curated Collection.

The birth of a map

On May 25, 2020, news of George Floyd’s murder in Minneapolis spread rapidly across the country, igniting protests and rallies seeking justice. On June 9, a small team consisting of a product manager, engineer, designer, and content editor came together to build a map for these events on Eventbrite.com.

The plan was to create a map on Eventbrite that led users to protests across the United States. This map would aggregate Black Lives Matter protests and allow our users to interact based on their location. While some projects exemplify technical ingenuity of a team, this one relied on quick thinking and action, teamwork, and a driving force of passion. There are always a number of technical solutions to test out, but sometimes it’s simpler to leverage people.

Company buy-in and teamwork

The fact that this map lives on our homepage means that everyone, including event organizers and consumers would see this high-touch feature. That means that we needed quick buy-in from the whole company, especially impacted department leads, to launch this feature while protests were still occurring nation-wide. This project was greenlit in a matter of days. 

The trust involved in getting this map out the door was important to our success. Legal, PR, and marketing all came together to bring this project to life, it was a true cross-functional effort.

Collections and discovery

When we were in the brainstorming phase, we faced the question of how to populate the map with events that were specifically protests in support of Black Lives Matter. Our first instinct was to construct a query to identify events that would fit into the theme.

For a simple example, we could return events where the event’s organizer had selected the “Rally” format when they created the event. Then further filter those results by events where the organizer had entered a description containing the text “BLM” or “George Floyd.”

We quickly realized this wasn’t going to produce good results. Variations on this approach would either be over-specific or too broad, including far too many irrelevant events or excluding relevant ones. Plus, it would have been vulnerable to trolling and require us to constantly adjust the query as people learned how to configure their events to show up on the map.

It was probably naive to have even tried that approach, but the obvious alternative had its downsides too. The alternative being manual, human-driven curation through the use of an existing feature on our platform called “Collections.”

Collections allow Eventbrite users to create collections of events. Any user on Eventbrite can create a collection simply by clicking the “heart” icon on an event card:

Our marketing team uses this feature to highlight particularly interesting events that adhere to certain themes: online yoga classes, drive-in concerts, etc. Sometimes you’ll see it in our product under the name of “Editor’s Picks.”

But as mentioned above, this approach has downsides. It takes significant manual work to identify all the events that we want to be part of the collection. And event inventory has a unique challenge: events end. At some point in time, a planned event will take place and the content is no longer relevant to show consumers. The Collections feature depends on the same Elasticsearch index we use for search, and due to various constraints we actively remove events from the index after they end. 

Since we remove ended events, we run the risk of showing a sparse or empty map if we don’t maintain the collection. This meant that someone would have to constantly keep an eye on this collection and keep it updated with new events as people create them on our platform.

Luckily, we had help.

The initial list of protests came together through help from the rest of the company, specifically our company’s global diversity group, collaborating on Slack and Google Sheets.

After we launched, Eventbrite Co-founder and CEO, Julia Hartz was so inspired by the work that she offered extra funding for the marketing team to continue the work of identifying relevant events for the map. That’s some of the most positive internal feedback you can get!

The nuts-and-bolts

While this was a straightforward project from a technical implementation standpoint, for the most part leveraging an existing feature rather than building something entirely new, it’s worth highlighting the work we’ve done in Eventbrite Engineering over the past year to invest in our architecture and infrastructure. Like many companies, Eventbrite is undergoing the difficult process of moving away from a monolithic architecture to a microservices architecture (ours has a domain-driven spin). We call the monolith “Core.”

Although we’re nowhere close to finished, we’re already starting to reap the benefits of the hard work invested in moving features out of Core, piece by piece. A little over a year ago, it wouldn’t have been feasible to ship a project of this nature so quickly because deploying any part of the site, no matter how small, required deploying all of Core. Today, we can ship changes to the homepage within a matter of minutes. 

Just as importantly, we have reliable alerting to notify us of problems that arise after shipping a change. As a matter of fact, shortly after we launched this project we were alerted of an unusual spike in errors on the homepage. Within 5 minutes of receiving this notification, we rolled back the release containing the map. After another 10 minutes, we re-released the map with the fix.

Bringing people together

Our company’s mission is simple: Bring the world together through live experiences. Protests themselves bring together like-minded individuals to fight towards a common goal. Working on a feature that exemplifies our mission as a company was a truly inspiring opportunity. This lit a fire in our team that translated to the company as a whole.

Authors: Eloise Porter, Jaylum Chen, Alex Rice, and Allen Jilo

Teaching new Presto performance tricks to the Old-School DBA

I’ve spent much of my career working with relational databases such as Oracle and MySQL, and SQL performance has always been an area of focus for me. I’ve spent countless hours reviewing EXPLAIN plans, rewriting subqueries, adding new indexes, and chasing down table-scans. I’ve been trained to make performance improvements such as:  only choose columns in a SELECT that are absolutely necessary, stay away from LIKE clauses, review the cardinality of columns before adding indexes, and always JOIN on indexed columns.

It’s been an instinctual part of my life as a Database Administrator who supports OLTP databases that have sold in excess of 20K tickets per minute to your favorite events. I remember a specific situation where a missing index caused our production databases to get flooded with table-scans that brought a world-wide on-sale to an immediate halt. I had a lot of explaining to do that day as the missing index made it to QA and Stage but not Production!

In recent years, I’ve transitioned to Data Engineering and began supporting Big Data environments.  Specifically, I’m supporting Eventbrite’s Data Warehouse which leverages Presto and Apache Hive using the Presto/Hive connector. The data files can be of different formats, but we’re using HDFS and S3.  The Hive metadata describes how data stored in HDFS/S3 maps to schemas, tables, and columns to be queried via SQL. We persist this metadata information in Amazon Aurora and access it through the Presto/Hive connector via the Hive Metastore Service (HMS). 

The stakes have changed and so have the skill-sets required. I’ve needed to retrain myself in how to write optimal SQL for Presto. Some of the best practices for Presto are the same as relational databases and others are brand new to me. This blog post summarizes some of the similarities and some of the differences with writing efficient SQL on MySQL vs Presto/Hive. Along the way I’ve had to learn new terms such as “federated queries”, “broadcast joins”, “reshuffling”, “join reordering”, and “predicate pushdown”.

Let’s start with the basics:

What is MySQL? The world’s most popular open source database. The MySQL software delivers a fast, multi-threaded, multi-user, and robust SQL (Structured Query Language) database server. MySQL is intended for mission-critical, heavy-load production database usage.

What is Presto? Presto is an open source distributed SQL query engine for running interactive analytic queries against data sources of all sizes ranging from gigabytes to petabytes. Presto doesn’t use the map reduce framework for its execution. Instead, Presto directly accesses the data through a specialized distributed query engine that is very similar to those found in commercial parallel relational databases.

Presto uses ANSI SQL syntax/semantics to build its queries. The advantage of this is that analysts with experience with relational databases will find it very easy and straightforward to write Presto queries! That said, the best practices for developing efficient SQL via Presto/Hive are different from those used to query standard RDBMS databases.

Let’s transition to Presto performance tuning tips and how they compare to standard best practices with MySQL.


1. Only specify the columns you need

Restricting columns for SELECTs can improve your query performance significantly. Specify only needed columns instead of using a wildcard (*). This applies to Presto as well as MySQL! 


2. Consider the cardinality within GROUP BY

When using GROUP BY, order the columns by the highest cardinality (that is, most number of unique values) to the lowest.

The GROUP BY operator distributes rows based on the order of the columns to the worker nodes, which hold the GROUP BY values in memory. As rows are being ingested, the GROUP BY columns are looked up in memory and the values are compared. If the GROUP BY columns match, the values are then aggregated together.


3. Use LIMIT with ORDER BY

The ORDER BY clause returns the results of a query in sort order. To  process the sort, Presto must send all rows of data to a single worker and then sort them. This sort can be a very memory-intensive operation for large datasets that will put strain on the Presto workers. The end result will be long execution times and/or memory errors. 

If you are using the ORDER BY clause to look at the top N values, then use a LIMIT clause to reduce the cost of the sort significantly by pushing the sorting/limiting to individual workers, rather than the sorting being done by a single worker. 

I highly recommend you use the LIMIT clause not just for SQL with ORDER BY but in any situation when you’re validating new SQL. This is good practice for MySQL as well as Presto!


4. Using approximate aggregate functions

When exploring large datasets often an approximation (with standard deviation of 2.3%) is more than good enough! Presto has approximate aggregation functions that give you significant performance improvements. Using the approx_distinct(x) function on large data sets vs COUNT(DISTINCT x) will result in performance gains. 

When an exact number may not be required―for instance, if you are looking for a rough estimate of the number of New Years events in the Greater New York area then consider using approx_distinct(). This function minimizes the memory usage by counting unique hashes of values instead of entire strings. The drawback is that there is a small standard deviation.


5. Aggregating a series of LIKE clauses in one single regexp_like clause

The LIKE operation is well known to be slow especially when not anchored to the left (i.e. the search text is surrounded by ‘%’ on both sides) or when used with a series of OR conditions. So it is no surprise that Presto’s query optimizer is unable to improve queries that contain many LIKE clauses.  

We’ve found improved  LIKE performance on Presto by  substituting the LIKE/OR  combination with a single REGEXP_LIKE clause, which is Presto native.  Not only is it easier to read but it’s also more performant. Based on some quick performance tests, we see ~30% increase in run-times with REGEXP_LIKE vs comparable LIKE/OR combination.

For example:

SELECT  ...FROM zoo 
WHERE method LIKE '%monkey%' OR 
      method LIKE '%hippo%' OR 
      method LIKE '%tiger%' OR 
      method LIKE '%elephant%'

can be optimized by replacing the four LIKE clauses with a single REGEXP_LIKE clause:

SELECT  ...FROM zoo 
WHERE REGEXP_LIKE(method, 'monkey|hippo|tiger|elephant')


6. Specifying large tables first in join clause

When joining tables, specify the largest table first in the join. The default join algorithm of Presto is broadcast join, which partitions the left-hand side table of a join and sends (broadcasts) a copy of the entire right-hand side table to all of the worker nodes that have the partitions. If the right-hand side table is “small” then it can be replicated to all the join workers which will save CPU and network costs.  This type of join will be most efficient when the right-hand side table is small enough to fit within one node. 

If you receive an ‘Exceeded max memory’ error, then the right-hand side table is too large. Presto does not perform automatic join-reordering, so make sure your largest table is the first table in your sequence of joins. 

This was an interesting performance tip for me. As we know, SQL is a declarative language and the ordering of tables used in joins in MySQL, for example,  is *NOT* particularly important. The MySQL optimizer will re-order to choose the most efficient path. With Presto, the join order matters. You’ve been WARNED! Presto does not perform automatic join-reordering unless using the Cost Based Optimizer!


7. Turning on the distributed hash join

If you’re battling with memory errors then try a distributed hash join. This algorithm partitions both the left and right tables using the hash values of the join keys. So the distributed join works even if the right-hand side table is large, but the performance might be slower because the join increases the number of network data transfers. 

At Eventbrite we have the distributed_join variable set to ‘true’. (SHOW SESSION). Also it can be enabled by setting a session property (set session distributed_join = ‘true’).


8. Partition your data

Partitioning divides your table into parts and keeps the related data together based on column values such as date or country.  You define partitions at table creation, and they help reduce the amount of data scanned per query, thereby improving performance. 

Here are some hints on partitioning:

  • Columns that are used as WHERE filters are good candidates for partitioning.
  • Partitioning has a cost. As the number of partitions in your table increases, the higher the overhead of retrieving and processing the partition metadata, and the smaller your files. Use caution when partitioning and make sure you don’t partition too finely. 
  • If your data is heavily skewed to one partition value, and most queries use that value, then the overhead may wipe out the initial benefit.

A key partition column at Eventbrite is transaction date (txn_date).

CREATE TABLE IF NOT EXISTS fact_ticket_purchase
(
    ticket_id STRING,
....
    create_date STRING,
    update_date STRING
)
PARTITIONED BY (trx_date STRING)
STORED AS PARQUET
TBLPROPERTIES ('parquet.compression'='SNAPPY')


9. Optimize columnar data store generation

Apache Parquet and Apache ORC are popular columnar data stores. They provide features that store data efficiently by using column-wise compression based on data type, special encoding, and predicate pushdown. At Eventbrite, we define Hive tables as PARQUET using compression equal to SNAPPY….

CREATE TABLE IF NOT EXISTS dim_event
(
    dim_event_id STRING,
....
    create_date STRING,
    update_date STRING,

)
STORED AS PARQUET
TBLPROPERTIES ('parquet.compression'='SNAPPY')

Apache Parquet is an open-source, column-oriented data storage format. Snappy is designed for speed and will not overload your CPU cores. The downside of course is that it does not compress as well as gzip or bzip2.


10. Presto’s Cost-Based Optimizer/Join Reordering 

We’re not currently using Presto’s Cost-Based Optimizer (CBO)! Eventbrite data engineering released Presto 330 in March 2020, but we haven’t tested CBO yet.

CBO inherently requires the table stats be up-to-date which we only calculate for a small subset of tables! Using the CBO, Presto will be able to intelligently decide the best sequence based on the statistics stored in the Hive Metastore.

As mentioned above, the order in which joins are executed in a query can have a big impact on performance. If we collect table statistics then the CBO can automatically pick the join order with the lowest computed costs. This is governed by the join_reordering_strategy (=AUTOMATIC) session property and I’m really excited to see this feature in action.

Another interesting join optimization is dynamic filtering. It relies on the stats estimates of the CBO to correctly convert the join distribution type to “broadcast” join. By using dynamic filtering via run-time predicate pushdown, we can squeeze out more performance gains for highly-selective inner-joins.  We look forward to using this feature in the near future!


11. Using WITH Clause

The WITH clause is used to define an inline view within a single query.  It allows for flattening nested subqueries. I find it hugely helpful for simplifying SQL, and making it more readable and easier to support.


12. Use Presto Web Interface

Presto provides a web interface for monitoring queries (https://prestodb.io/docs/current/admin/web-interface.html). 

The main page has a list of queries along with information like unique query ID, query text, query state, percentage completed, username and source from which this query originated. If Presto cluster is having any performance-related issues, this web interface is a good place to go to identify and capture slow running SQL!


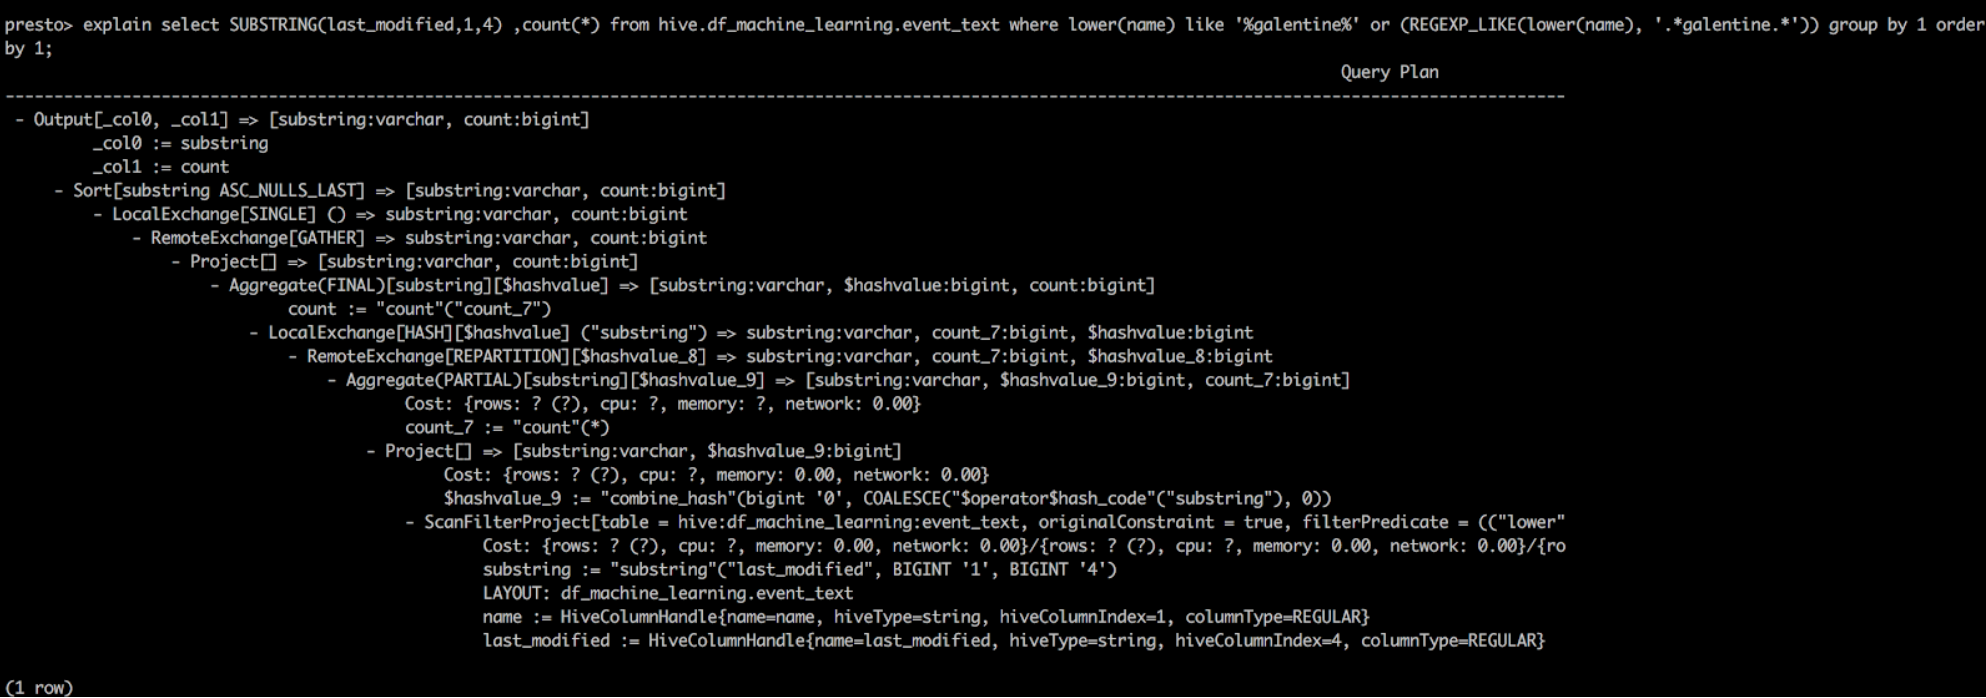
13. Explain plan with Presto/Hive (Sample)

EXPLAIN is an invaluable tool for showing the logical or distributed execution plan of a statement and to validate the SQL statements. 

Logical Plan with Presto

explain select SUBSTRING(last_modified,1,4) ,count(*)  from hive.df_machine_learning.event_text where lower(name) like ‘%wilbraham%’ or (REGEXP_LIKE(lower(name), ‘.*wilbraham.*’)) group by 1 order by 1;


14. Explain plan with MySQL (Sample)

In this particular case you can see that the primary key is used on the ‘ejp_events’ table and the non-primary key on the “ejp_orders’ table. This query is going to be fast!


Conclusion

Presto is the “SQL-on-Anything” solution that powers Eventbrite’s data warehouse. It’s been very rewarding for me as the “Old School DBA” to learn new SQL tricks related to a distributed query engine such as Presto. In most cases, my SQL training on MySQL/Oracle has served me well but there are some interesting differences which I’ve attempted to call-out above. Thanks for reading and making it to the end. I appreciate it!

We look forward to giving Presto’s Cost-Based Optimizer a test drive and kicking the tires on new features such as dynamic filtering & partition pruning!

All comments are welcome, or you can message me at ed@eventbrite.com. You can learn more about Eventbrite’s use of Presto by checking out my previous post at Boosting Big Data workloads with Presto Auto Scaling.

Special thanks to Eventbrite’s Data Foundry team (Jeremy Bakker,  Alex Meyer, Jasper Groot, Rainu Ittycheriah, Gray Pickney, and Beck Cronin-Dixon) for the world-class Presto support, and Steven Fast for reviewing this blog post. Eventbrite’s Data Teams rock!

Leveraging AWS “spot” instances to drive down costs

I had the pleasure of participating in a Big Data Cost Optimization event in San Francisco (October 17) at the AWS Loft location. I was a panelist in a round-table discussion focusing on the use of AWS spot instances. It was a terrific opportunity to share how Eventbrite’s Data Engineering team is smartly using spot instances for Big Data & EMR to drive down costs. Thanks to Jasper Groot from the Data Engineering team for helping to co-author this blog post!

At Eventbrite, we’re using spot instances to leverage AWS auto scaling and I’ve published a blog entry on this topic (Big Data workloads with Presto Auto Scaling). Two key focus areas for the data engineering team are ephemeral computing (something that lasts for a very short time)  and idempotence (repeatable behaviour with the same outcome).  Making a commitment in these areas has allowed us to leverage spot instances to effectively manage costs.

Spot instances are a cost-effective choice if you can be flexible about when your applications run and if your applications can be interrupted. They are well-suited for data analysis, batch jobs, background processing, and non mission-critical tasks. Below are some of the panel questions and my answers, and I’d love to share what I learned based on the conversation.
Continue reading “Leveraging AWS “spot” instances to drive down costs”

Boosting Big Data workloads with Presto Auto Scaling

The Data Engineering team at Eventbrite recently completed several significant improvements to our data ecosystem. In particular, we focused on upgrading our data warehouse infrastructure and improving the tools used to drive Eventbrite’s data-driven analytics.

Here are a few highlights:

  • Transitioned to a new Hadoop cluster. The result is a more reliant, secure, and performant data warehouse environment.
  • Upgraded to the latest version of Tableau and migrated our Tableau servers to the same  AWS infrastructure as Presto. We also configured Tableau to connect via its own dedicated Presto cluster. The data transfer rates, especially for Tableau extracts, are 10x faster!
  • We upgraded Presto and fine-tuned the resource allocation (via AWS Auto Scaling) to make the environment optimal for Eventbrite’s analysts. Presto is now faster and more stable. Our daily Tableau dashboards, as well as our ad-hoc SQL queries, are running 2 to 4 times faster.

This post focuses on how Eventbrite leverages AWS Auto Scaling for Presto using Auto Scaling Groups, Scaling Policies, and Launch Configurations. This update has allowed us to meet the data exploration needs of our Engineers, Analysts, and Data Scientists by providing better throughput at a fraction of the cost.

High level overview

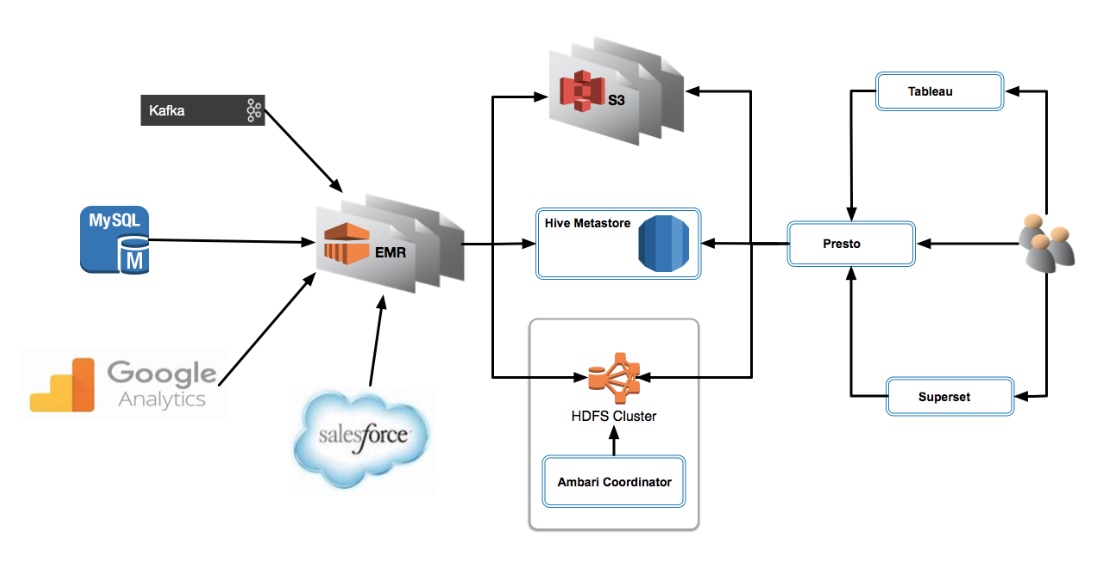
Let’s start with a high-level view of our data warehouse environment running on AWS.

Auto Scale Overview

Analytics tools: Presto, Superset and Tableau

We’re using Presto to access data in our data warehouse. Presto is a tool designed to query vast amounts of data using distributed queries. It supports the ANSI SQL standard, including complex queries, aggregations, and joins. The Presto team designed it as an alternative to tools that query HDFS using pipelines of MapReduce jobs. It connects to a Hive Metastore allowing users to share the same data with Hive, Spark, and other Hadoop ecosystem tools.

We’re also using Apache Superset packaged alongside Presto. Superset is a data exploration web application that enables users to process data in a variety of ways including writing SQL queries, creating new tables and downloading data in CSV format. Among other tools, we rely heavily on Superset’s SQL Lab IDE to explore and preview tables in Presto, compose SQL queries, and save output files as CSV.

We’re exploring the use of Superset for dashboard prototyping although currently the majority of our data visualization requirements are being met by Tableau. We use Tableau to represent Eventbrite’s data in dashboards that are easily digestible by the business.

The advantage of Superset is that it’s open-source and cost-effective, although we have performance concerns due to lack of caching and it’s missing some features (triggers on charts, tool-tips, support for non-SQL functions, scheduling) that we would like to see. We plan to continue to leverage Tableau as our data visualization tool, but we also plan to adopt more Superset usage in the future.

Both Tableau and Superset connect to Presto,  which retrieves data from Hive tables located on S3 and HDFS commonly stored as Parquet.

Auto scaling overview

Amazon EC2 Auto Scaling enables us to follow the demand curve for our applications, and thus reduces the need to manually provision Amazon EC2 capacity in advance. For example, we can use target tracking scaling policies to select a load metric for our application, such as CPU utilization or via the Presto metrics.

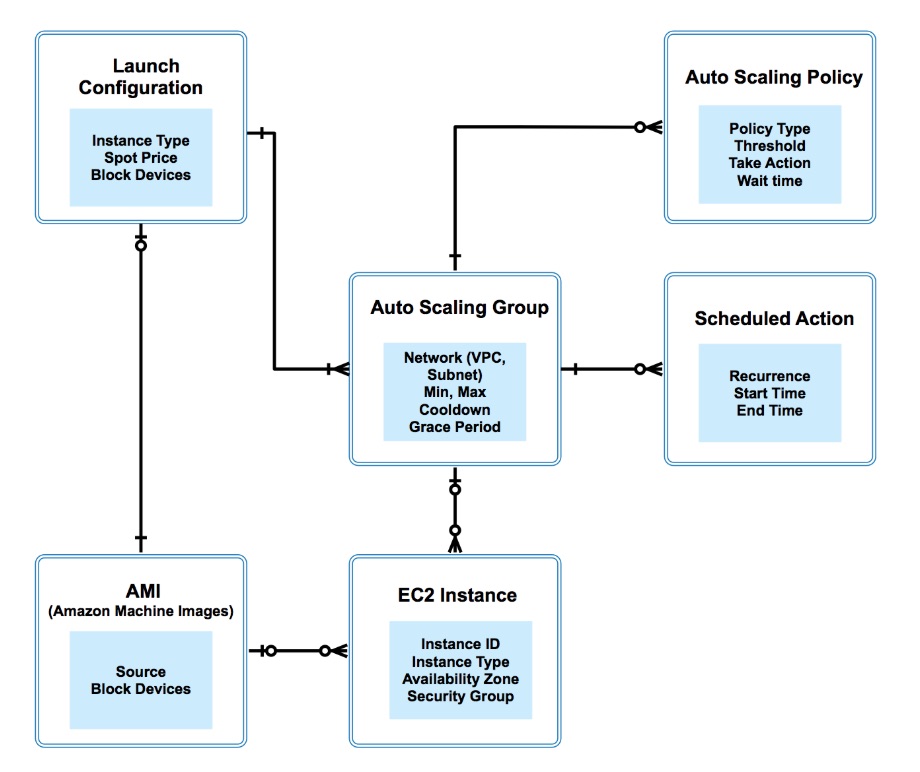
It’s critical to understand the terminology for AWS Auto Scaling. Tools such as “Launch Configuration,”  “Auto Scaling Group” and “Auto Scaling Policy” are vital components we show below. Here is a diagram that shows the relationship between the main components of AWS Auto Scaling. As an old-school data modeler, I tend to think in terms of entities and relationships via the traditional ERD model 😀

Auto Scaling ERD

Presto auto scaling

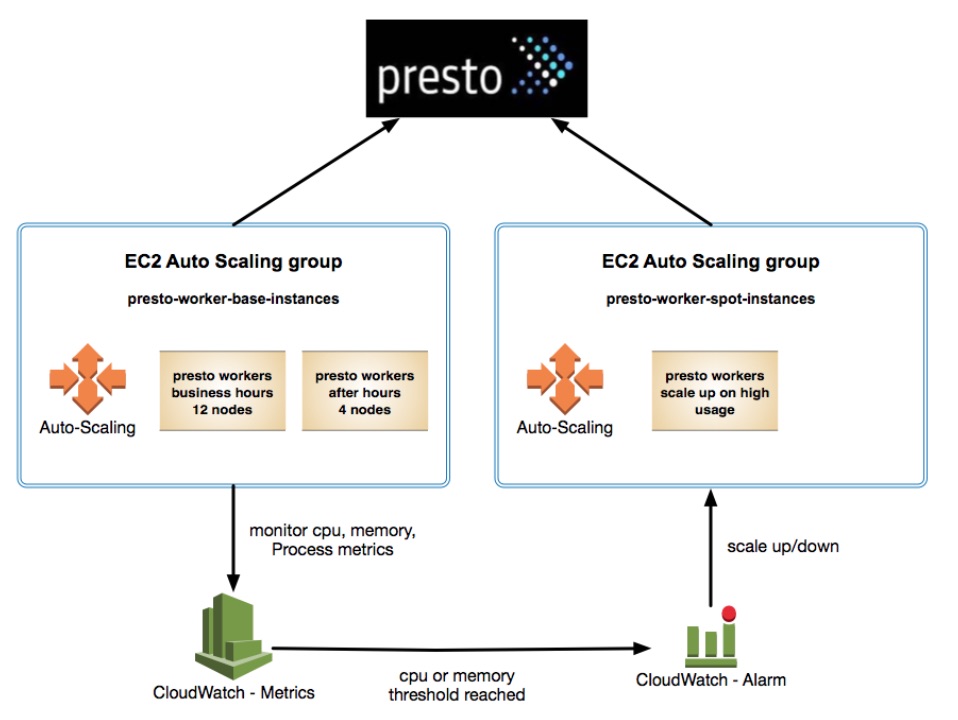
We’re using AWS Auto Scaling for our Presto “spot” instances based on (I) CPU usage and (II) number of queries (only used for scaledown). Here is an overview of our EC2 auto-scaling setup for Presto.

Auto Scaling with Presto

Here are some sample policies:

Policy type:  Simple scaling (I)

Execute policy when:  CPU Utilization >= 50 for 60 seconds for the metric dimensions .

Take the action:  Add 10 instances (provided by EC2).

Policy type: Simple scaling (II)

Execute policy when: running Queries <= 0 for 2 consecutive periods of 300 seconds for the metric dimensions.

Take the action: Set to 0 instances.

Note: A custom Python script was developed by Eventbrite’s Data Engineering team to handshake with Cloudwatch concerning scaledown.  It handles the race condition where another query comes in during the scaledown process. We’ve added “termination protection” which leverages this Python script (running as a daemon) on each Presto worker node. If it detects a query is currently running on this node, then it won’t scale down.

Tableau scheduled actions

We’re using “Scheduled Scaling” features for our Tableau Presto instances as well as our “base” instances used for Presto. We scale up the instances in the morning and scale down at night. We’ve set up scheduled scaling based on predictable workloads such as Tableau.

“Scheduled Scaling” requires configuration of scheduled actions, which tells Amazon EC2 Auto Scaling to act at a specific time. For each scheduled action, we’ve specified the start time, and the new minimum, maximum, and the desired size of the group. Here is a sample setup for scheduled actions:

Auto scale actions

Cloudwatch

We’ve enabled Auto Scaling Group Metrics to identify capacity changes via CloudWatch alarms. When triggered, these alarms will cause autoscaling groups to execute the policy when a threshold is breached. In some cases, we’re using EC2 alerts and in others, we’re pushing custom metrics through python scripts to Cloudwatch.

Sample Cloudwatch alarms:

Multiple Presto clusters

We’ve separated Tableau connections from ad-hoc Presto connections. This abstraction allows us to separate ad-hoc query usage from Tableau usage.

EMR

Our Presto workers read data that is written by our persistent EMR clusters.  Our ingestion and ETL jobs run on daily and hourly scheduled EMR clusters with access to Spark, Hive and Sqoop. Using EMR allows us to decouple storage from computation by using a combination of S3 and a custom HDFS cluster. The key is we only pay for computation when we use it!

We have multiple EMR clusters that write the data to Hive tables backed by S3 and  HDFS. We launch EMR clusters to run our ETL processes that load our data warehouse tables daily/hourly. We don’t currently tie our EMR clusters to auto-scaling.

By default, EMR stores Hive Metastore information in a MySQL database on the master node. It is the central repository of Apache Hive metadata and includes information such as schema structure, location, and partitions. When a cluster terminates, we lose the local data because the node file systems use ephemeral storage. We need the Metastore to persist, so we’ve created an external Metastore that exists outside the cluster.

We’re not using the AWS Glue Data Catalog. The Data Engineering team at Eventbrite is happy managing our Hive Metastore on Amazon Aurora. If something breaks, like we’ve had in the past with Presto race conditions writing to the Hive Metastore, then we’re comfortable fixing it ourselves.

The Data Engineering team created a persistent EMR single node “cluster” used by Presto to access Hive. Presto is configured to read from this cluster to access the Hive Metastore. The Presto workers communicate with the cluster to relay where the data lives, partitions, and table structures.

The end

In summary, we’ve focused on upgrading our data warehouse infrastructure and improving the tools used to drive Eventbrite’s data-driven analytics.  AWS Auto Scaling has allowed us to improve efficiency for our analysts while saving on cost.  Benefits include:

Decreased Costs

AWS Auto Scaling allows us to only pay for the resources we need. When demand drops, AWS Auto Scaling removes any excess resource capacity, so we avoid overspending.

Improved Elasticity

AWS Auto Scaling allows us to dynamically increase and decrease capacity as needed. We’ve also eliminated lost productivity due to non-trivial error rates caused by failed queries due to capacity issues.

Improved Monitoring

We use metrics in Amazon CloudWatch to verify that our system is performing as expected. We also send metrics to CloudWatch that can be used to trigger AWS Auto Scaling policies we use to manage capacity.

All comments are welcome, or you can message me at ed@eventbrite.com. Thanks to Eventbrite’s Data Engineering crew (Brandon Hamric, Alex Meyer, Beck Cronin-Dixon, Gray Pickney and Paul Edwards) for executing on the plan to upgrade Eventbrite’s data ecosystem. Special thanks to Rainu Ittycheriah, Jasper Groot, and Jeremy Bakker for contributing/reviewing this blog post.

You can learn more about Eventbrite’s data infrastructure by checking out my previous post at Looking under the hood of the Eventbrite data pipeline.

Looking under the hood of the Eventbrite data pipeline!

Eventbrite’s mission is to bring the world together through live experiences. To achieve this goal, Eventbrite relies on data-driven decisions at every level. In this post, we explore Eventbrite’s treasure trove of data and how we leverage it to push the company forward. We also take a closer look at some of the data challenges we’ve faced and how we’re pushing forward with new improvements to address these challenges!

The Data Engineering team at Eventbrite ingests data from a number of different sources into a central repository.  This repository is the foundation for Eventbrite’s analytics platform. It empowers Eventbrite’s engineers, analysts, and data scientists to create data-driven solutions such as predictive analysis, algorithmic newsletters, tagging/clustering algorithms, high-value customer identification, and search/recommendations.

The Situation: Degrading performance and increasing cost of existing Data Warehouse running on Hadoop infrastructure (CDH5)

We use MySQL as our main production datastore, and it supported most of our data analytics/reporting until a few years ago. Then we implemented a Cloudera CDH ecosystem, starting with CDH3 and upgrading to CDH5 when it was released. Prior to phasing in our CDH environment, our main OLTP (online transaction processing) databases were also powering our reporting needs.

Our production MySQL topology consists of a Primary-Secondary setup, with the majority of the read-only traffic directed to the MySQL secondary instances. For many years, we met our reporting requirements by leveraging the read-only MySQL instances but it came at a steep price due to contention and performance issues caused by long-running SQL queries.

As a result, we moved much of our reporting to our new CDH environment, and we designed a new set of transformation tables to simplify the data access  for Engineers, Analysts and Business users. It’s served us well as the backbone for our Data Warehouse efforts, but the time had come to take the next step as we’ve faced a number of challenges:

Cost

Our CDH5 cluster lives on Reserved Instances, and all of the data in the cluster is housed on local solid state drives.  As a result, the cluster is expensive to maintain.

A Reserved Instance is a reservation of resources for an agreed upon period of time.  Unlike on-demand, when you purchase an RI (reserve instance), you commit to paying for all  the hours of the 1-year or 3-year term. The end result is a lower hourly rate, but the long term costs can really add up.

Analytics

We have a large collection of uncurated data, and we had not transformed the data into a single source-of-truth about our business. As a result, core business metrics (such as organizer, consumer, and event data) were reported differently in different places in the organization, and attributes such as currency, location and timezone were reported differently across business units.

Scheduling

Most jobs were scheduled via Oozie, there was little effective monitoring in place, and there was no method to track or enforce dependencies between coordinators. In addition, other analytics jobs that utilize Salesforce and MySQL data were scheduled through a local Windows machine that was prone to errors and regularly failed without warning or notification.

Processing/Elasticity

All ETL-processing and  ad-hoc queries executed on the same CDH5 cluster. Each process had its own load profile, so the cluster was configured to fit an aggregate of those loads. The end result was that jobs frequently conflicted with each other and competed for resources.

Our workload required burst capacity to support experimental development, ad-hoc queries, and routine ingestion scripts. In an ideal setup, we would scale up and scale down computing resources without any interruptions or data loss.

Ingestion

For MySQL ingestion, we used a home-grown wrapper called Sqoozie to integrate with our MySQL databases. Sqoozie combines Apache Sqoop – a command-line application for transferring data between relational databases and Hadoop – and Apache Oozie, a Hadoop workflow scheduler. It allows for writing MySQL tables directly to Hive tables. While this approach worked for smaller datasets, it became prohibitive as our data grew. Unfortunately, it was setup as a full ingestion of all tables each day and typically took most of a day to finish, putting high load on the shared resource cluster for an extended period of time.

For web analytics ingestion, we used a proprietary tool called Blammo-Kafka that pulled the web logs directly from Kafka daily and dumped them to Hive tables partitioned by day.

For Salesforce ingestion, we used the Salesforce Bulk API to ingest all objects daily and overwrite the previous day’s ingestion.

The Solution: EMR, Presto, Hive, and Luigi to the rescue!

In the past year, we’ve invested heavily in building a shiny new “data-foundry” ecosystem to alleviate many of the pain points from our previous CDH environment. It is the result of many whiteboard sessions, sleepless nights, and walks around the block at Eventbrite’s offices at our SOMA location in San Francisco and Cummins Station in Nashville.

We focused not only on improving stability and cost, but also on designing a new set of transformation tables that would become the canonical source-of-truth at the company level. This involved meeting with key stakeholders to understand business metrics and exploring new technologies. The following diagram depicts sample output from some of our working sessions. As you can tell, it was a tedious process.

The end result was the implementation of a new “data-foundry” infrastructure. The following diagram shows a general layout:

EMR (Elastic MapReduce) Clusters

Ingestion and ETL jobs run on daily and hourly scheduled EMR clusters with access to most Hadoop tools. Amazon’s EMR is a managed cluster platform that simplifies running big data frameworks such as Hadoop, Spark, Presto, and other applications in the Apache/Hadoop stack.

The EMR/S3 solution decouples storage from compute. You only pay for compute when you use it (high utilization). Multiple EMR clusters can access the data (S3, Hive Metastore), and interactive workloads (Hive, Presto, Spark) can be launched via on-demand clusters.

We’ve seen some benefits with Amazon EMR:

Intelligent resizing

  • Incrementally scale up (add nodes to EMR cluster) based on available capacity
  • Wait for work to complete before resizing down (removing nodes from EMR cluster)
  • Can scale core nodes and HDFS as well as task nodes

Cost Savings

By moving to EMR and S3, we’ve been able to considerably cut costs. With S3 we pay only for the storage that we use, not for total capacity. And with EMR, we’re able to take advantage of  “on-demand” pricing, paying low hourly rates for clusters only when we need the capacity. Also, we’ve reduced the cost even further by purchasing Reserved Instances and bidding on Spot instances.

  • Use Amazon EC2 spot instances to save > 80%
  • Use Amazon EC2 Reserved Instances for steady workloads

Reliability/Improved Operational Support

Amazon EMR monitors nodes in each cluster and automatically terminates and replaces an instance if there is a failure. Plus the new environment has been built from scratch, is configured via Terraform, and uses automated Ansible templates.

Job Scheduling

We use Luigi to orchestrate our Python jobs. Luigi enables us to easily define task workflows without having to know much about other workflows. It is an open source Python framework created by Spotify for managing data processing jobs, and it is really good at dependency management, which makes it a perfect tool for coalescing dependent data sources.

Centralized Hive Metastore

We have a centralized Hive metastore that saves all the structure information of the various tables, columns, and partitions for our Hive metadata. We chose Hive for most of our Hadoop jobs primarily because the SQL interface is simple. It is much cleaner than listing files in a directory to determine what output exists, and is also much faster and consistent because it’s backed by MySQL/RDS. This is particularly important since we rely on S3, which is slow at listing files and is prone to “eventual” consistency issues.

Ingestion

We continue to ingest production data from MySQL tables on a daily basis using Apache Sqoop, but in the “data-foundry” ecosystem we ingest the tables incrementally using “changed” columns to allow for quicker updates.

We ingest web analytics data by using Pinterest Secor to dump data from Kafka to S3. We then process it from that S3 path using Spark, both hourly and daily. Hourly we  ingest the latest data for each web analytics table since the last time it was ingested and write it to Hive tables partitioned by day and hour. Daily we also ingest the web analytics data to day partitioned Hive tables.

We ingest Salesforce data using a combination of the Salesforce REST and Bulk APIs using custom internal built Python clients for both. Tables are ingested through Spark using the API that makes the most sense based on the size of the data. Also, where available, we use primary key chunking in the Bulk API to optimize ingestion of large tables.

In addition to the ingestion processes that bring us to feature parity with the old CDH5 infrastructure, we also ingest data from a few other sources, including Google Analytics and several other 3rd party services.

We ingest Google Analytics data three times a day for the current day and once for the previous day based on SLAs provided by Google. We use Spark in addition to Google’s BigQuery and Cloud Storage clients to ingest Google Analytics data for our mobile app, organizer app, and web app to Hive tables partitioned by day.

Analytics

By separating analytics processing from visualization and queries, we’ve been able to explore more tooling options. Both Presto and Superset have proven to be useful.  

Presto is a distributed SQL query engine optimized for ad-hoc analysis. It supports the ANSI SQL standard, including complex queries, aggregations, and joins. Presto can run on multiple data sources, including Amazon S3. We’re using Presto with EC2 Auto Scaling Groups to dynamically scale based on usage patterns.

Presto’s execution framework is fundamentally different from that of Hive/MapReduce. It has a custom query and execution engine where the stages of execution are pipelined, similar to a directed acyclic graph (DAG), and all processing occurs in memory to reduce disk I/O. This pipelined execution model can run multiple stages in parallel, and it streams data from one stage to another as the data becomes available. This reduces end-to-end latency, and we’ve found Presto to be quite snappy for ad-hoc data exploration over large datasets.

An additional benefit is that Facebook and the open-source community are actively developing Presto, which has no vendor lock-in because it speaks ANSI-SQL.

Superset is a data exploration and visualization tool that was open sourced by Airbnb. It allows for fast and flexible data access and comes complete with a rich SQL IDE, which is used heavily by Eventbrite’s business analysts.

Transformations

We’ve introduced a new set of staging tables in our data warehouse that transform the raw data into dimension tables aligned specifically to meet business requirements.  These new tables enable analytics, data science, and reporting. The goal is to create a single “source-of-truth” for company metrics and company business concepts.

Data Exports

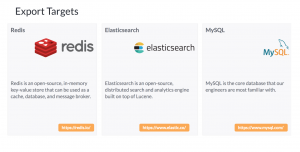
The Data Engineering team has developed a set of exporter jobs in Python to push data to targets such as Redis, Elasticsearch, Amazon S3 or MySQL. This allows us to the cache the results of queries to power reports, so that the data is available to everyone, whenever it is needed.

What next?

We’re looking for new ways to decrease our ingestion times from MySQL using stream processing with products such as Maxwell (http://maxwells-daemon.io/), which has been well-documented by Zendesk. Maxwell reads MySQL binlogs and writes row updates to Kafka as JSON. We’re also using SparkSQL and excited to use Apache Spark more broadly, especially Spark streaming.

We have a ton of enhancement requests to extend our Data Warehouse tables to meet the growing needs of the business and to provide better ways of visualizing the data via new Tableau dashboards.

As the Eventbrite family continues to grow with the acquisitions of Ticketscript, Ticketfly, and Ticketea, we continue to explore ways to migrate/combine data sources. This includes ingesting data from sources new to us, such as Amazon Redshift and Amazon Dynamo.

It’s fun times here at Eventbrite!

Special thanks to Eventbrite’s Data Engineering team: (Brandon Hamric, Alex Meyer, Will Gaggioli, Beck Cronin-Dixon, Jasper Groot, Jeremy Bakker, and Paul Edwards) for their contributions to this blog post. This team rocks!